COVID-19 model
Introduction
COVID-19 is a global pandemic caused by the novel coronavirus SARS-CoV-2. It has caused over 40,000,000 infections and costed over 800,000 lives as of August 25th, 2020 (according to the Worldometer's COVID-19 data). While effective vaccine is the only solution likely to end the transmission of the disease yet still unavailable, it is essential to understand its transmission dynamics and make accurate predictions about its outbreaks and spread in the future.
We develop a mathematical model, termed the cooperative infection model, or SINV model, for COVID-19 transmission dynamics in various countries and most states in the United States. While reproducing data of COVID-19 infections and deaths accurately, the model also suggests:
- Extremely aggressive interventions are indispensable to mitigate the spread of COVID-19 in the absence of vaccine
- Resistance to weak-to-moderate non-pharmacological interventions is an intrinsic property of COVID-19
- Present interventions in the United States have mitigated the COVID-19 pandemic to some extent, but the effects have been largely reversed by lifting of restrictions during the reopen
For more detailed information about the mathematical model and computer codes implementing the model, see my GitHub page.
Science behind the model
The mathematical model of COVID-19 was developed based on the classification of the entire population in a territory to three categories: Susceptible (S), Infected (I), and Non-susceptible (N). Infected individuals keep shedding virus particles which then enter a Virus Pool (V). The speed for susceptible individuals to be infected is determined by the number of susceptible individuals, S, and the size of virus pool, V. Infected individuals can either decease or recover, each producing non-susceptible individuals.
Overview of the COVID-19 model
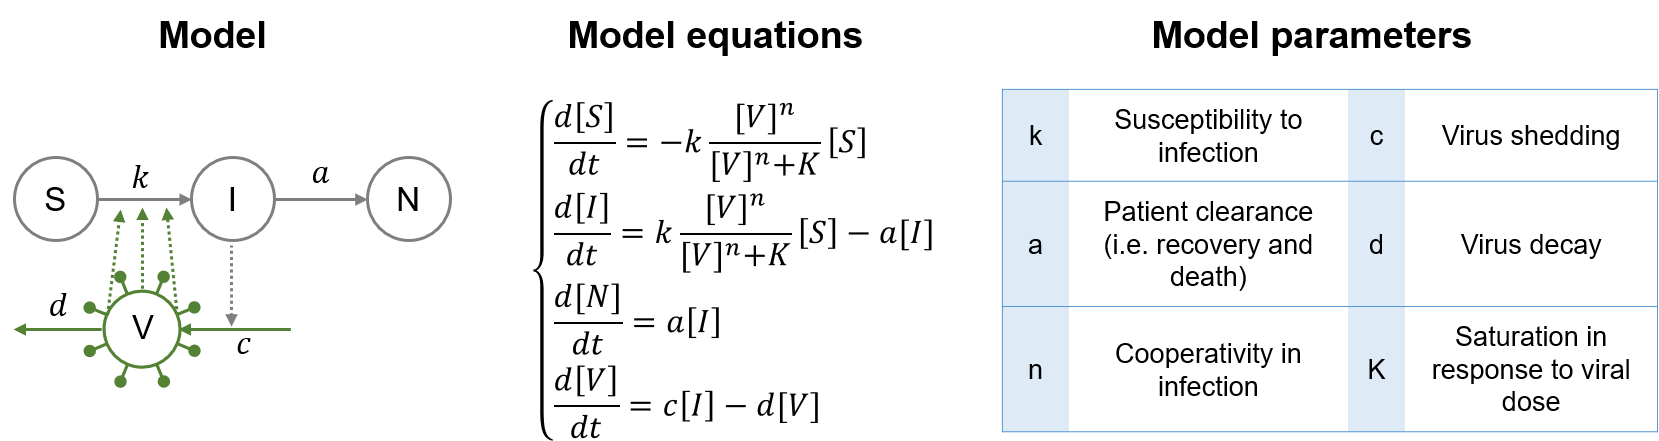
By introducing concepts and tools from the computational biology field to model the interaction between virus and human, this model can capture more complex dynamic behaviors compared to original epidemiological models, such as the SIR model, and better fit actual COVID-19 transmission data.
Models for COVID-19 in countries
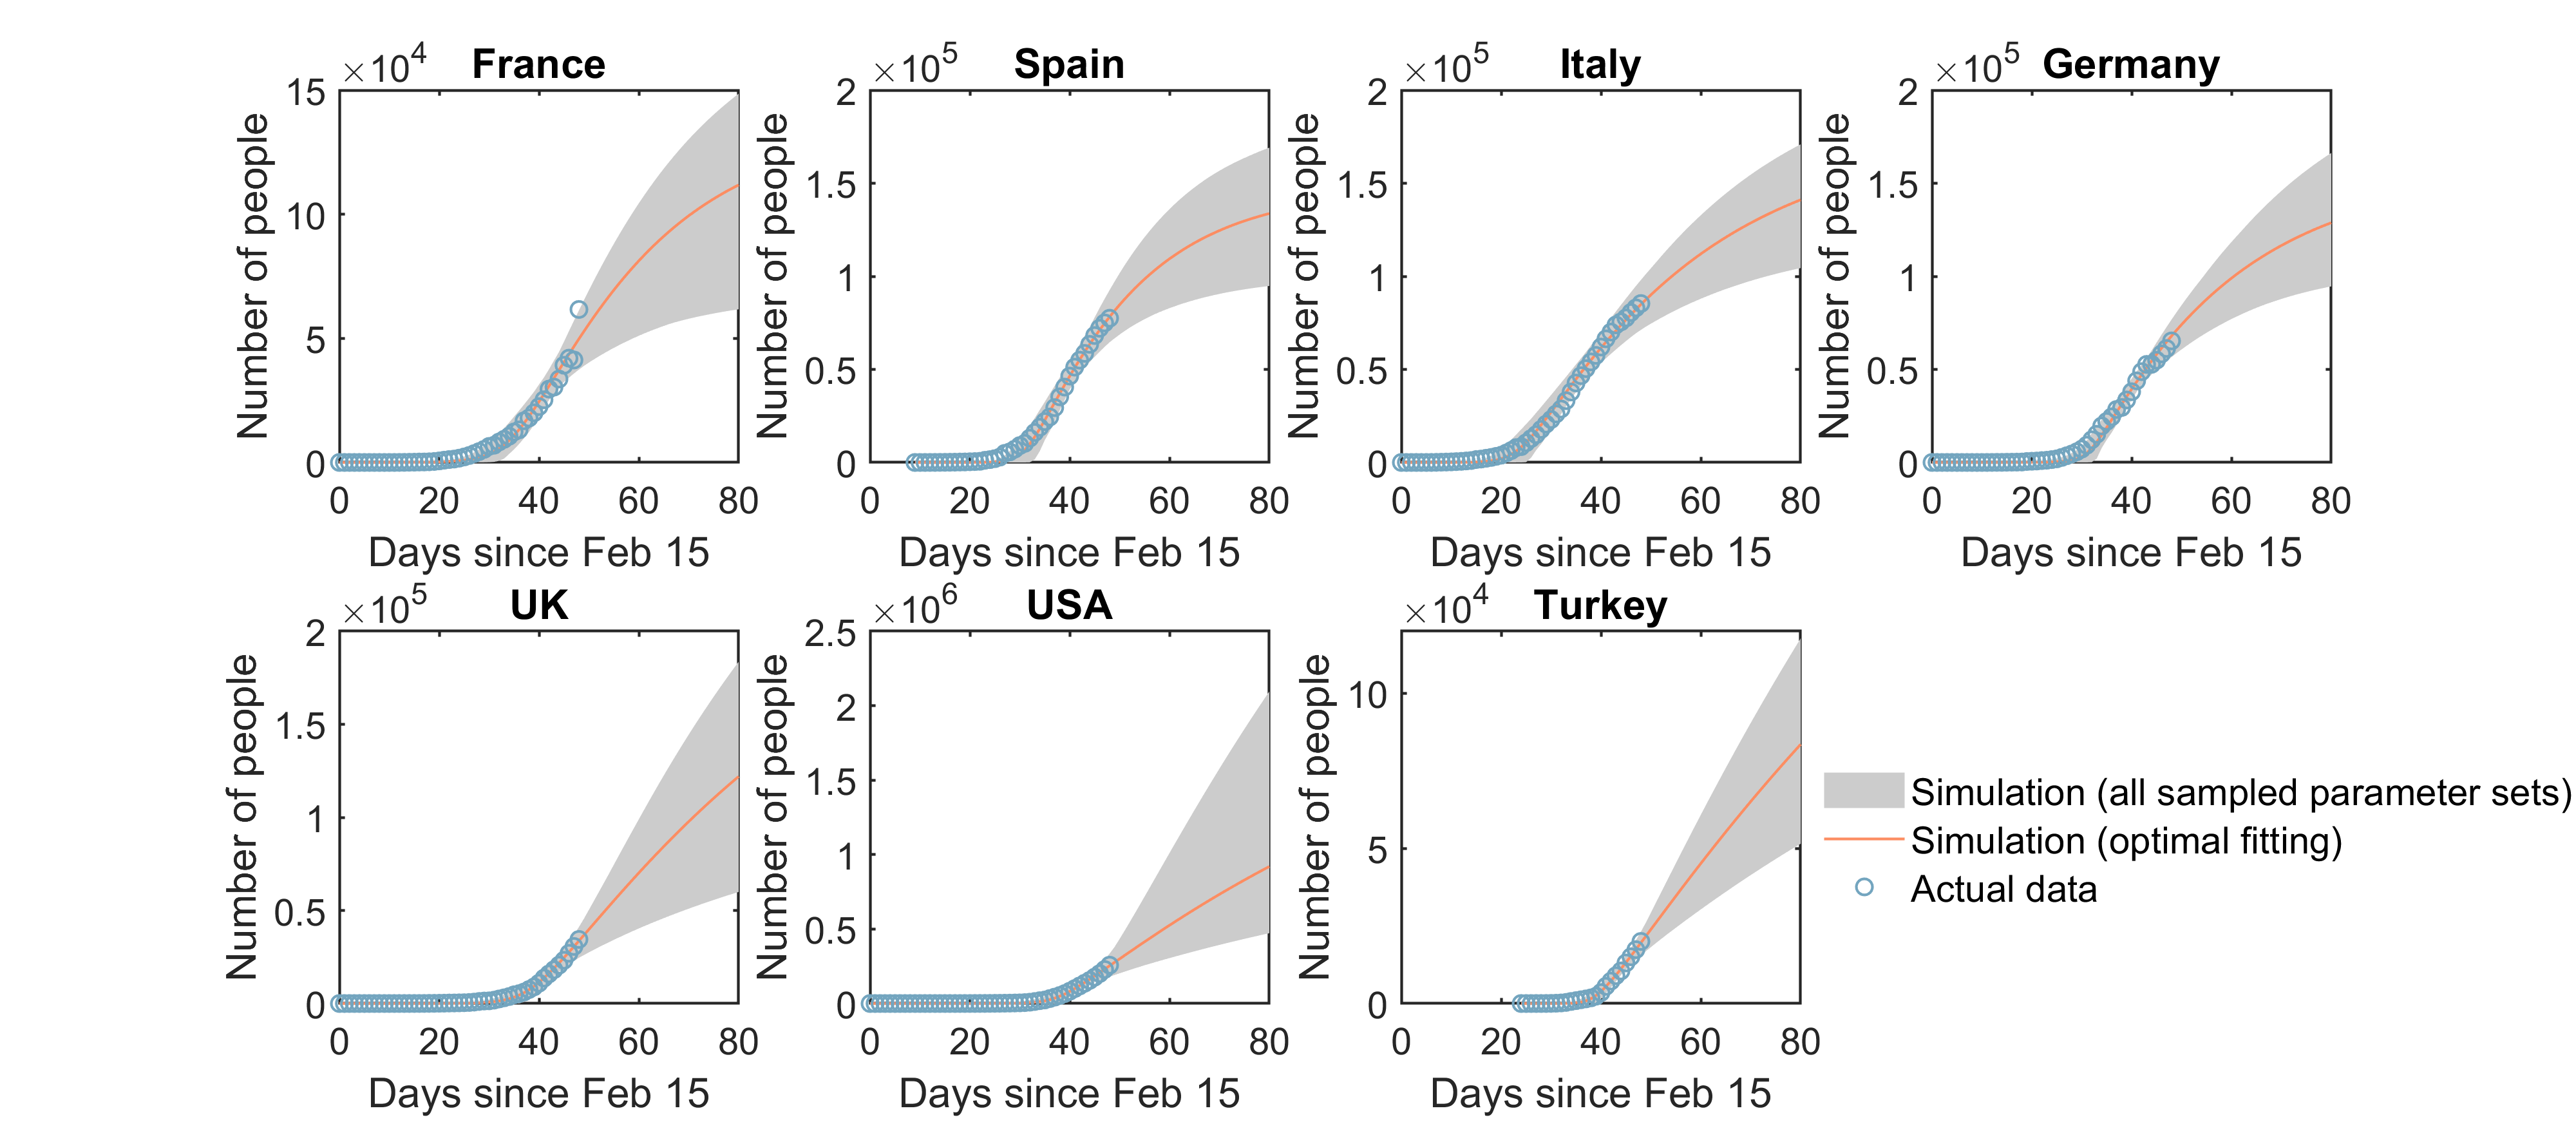
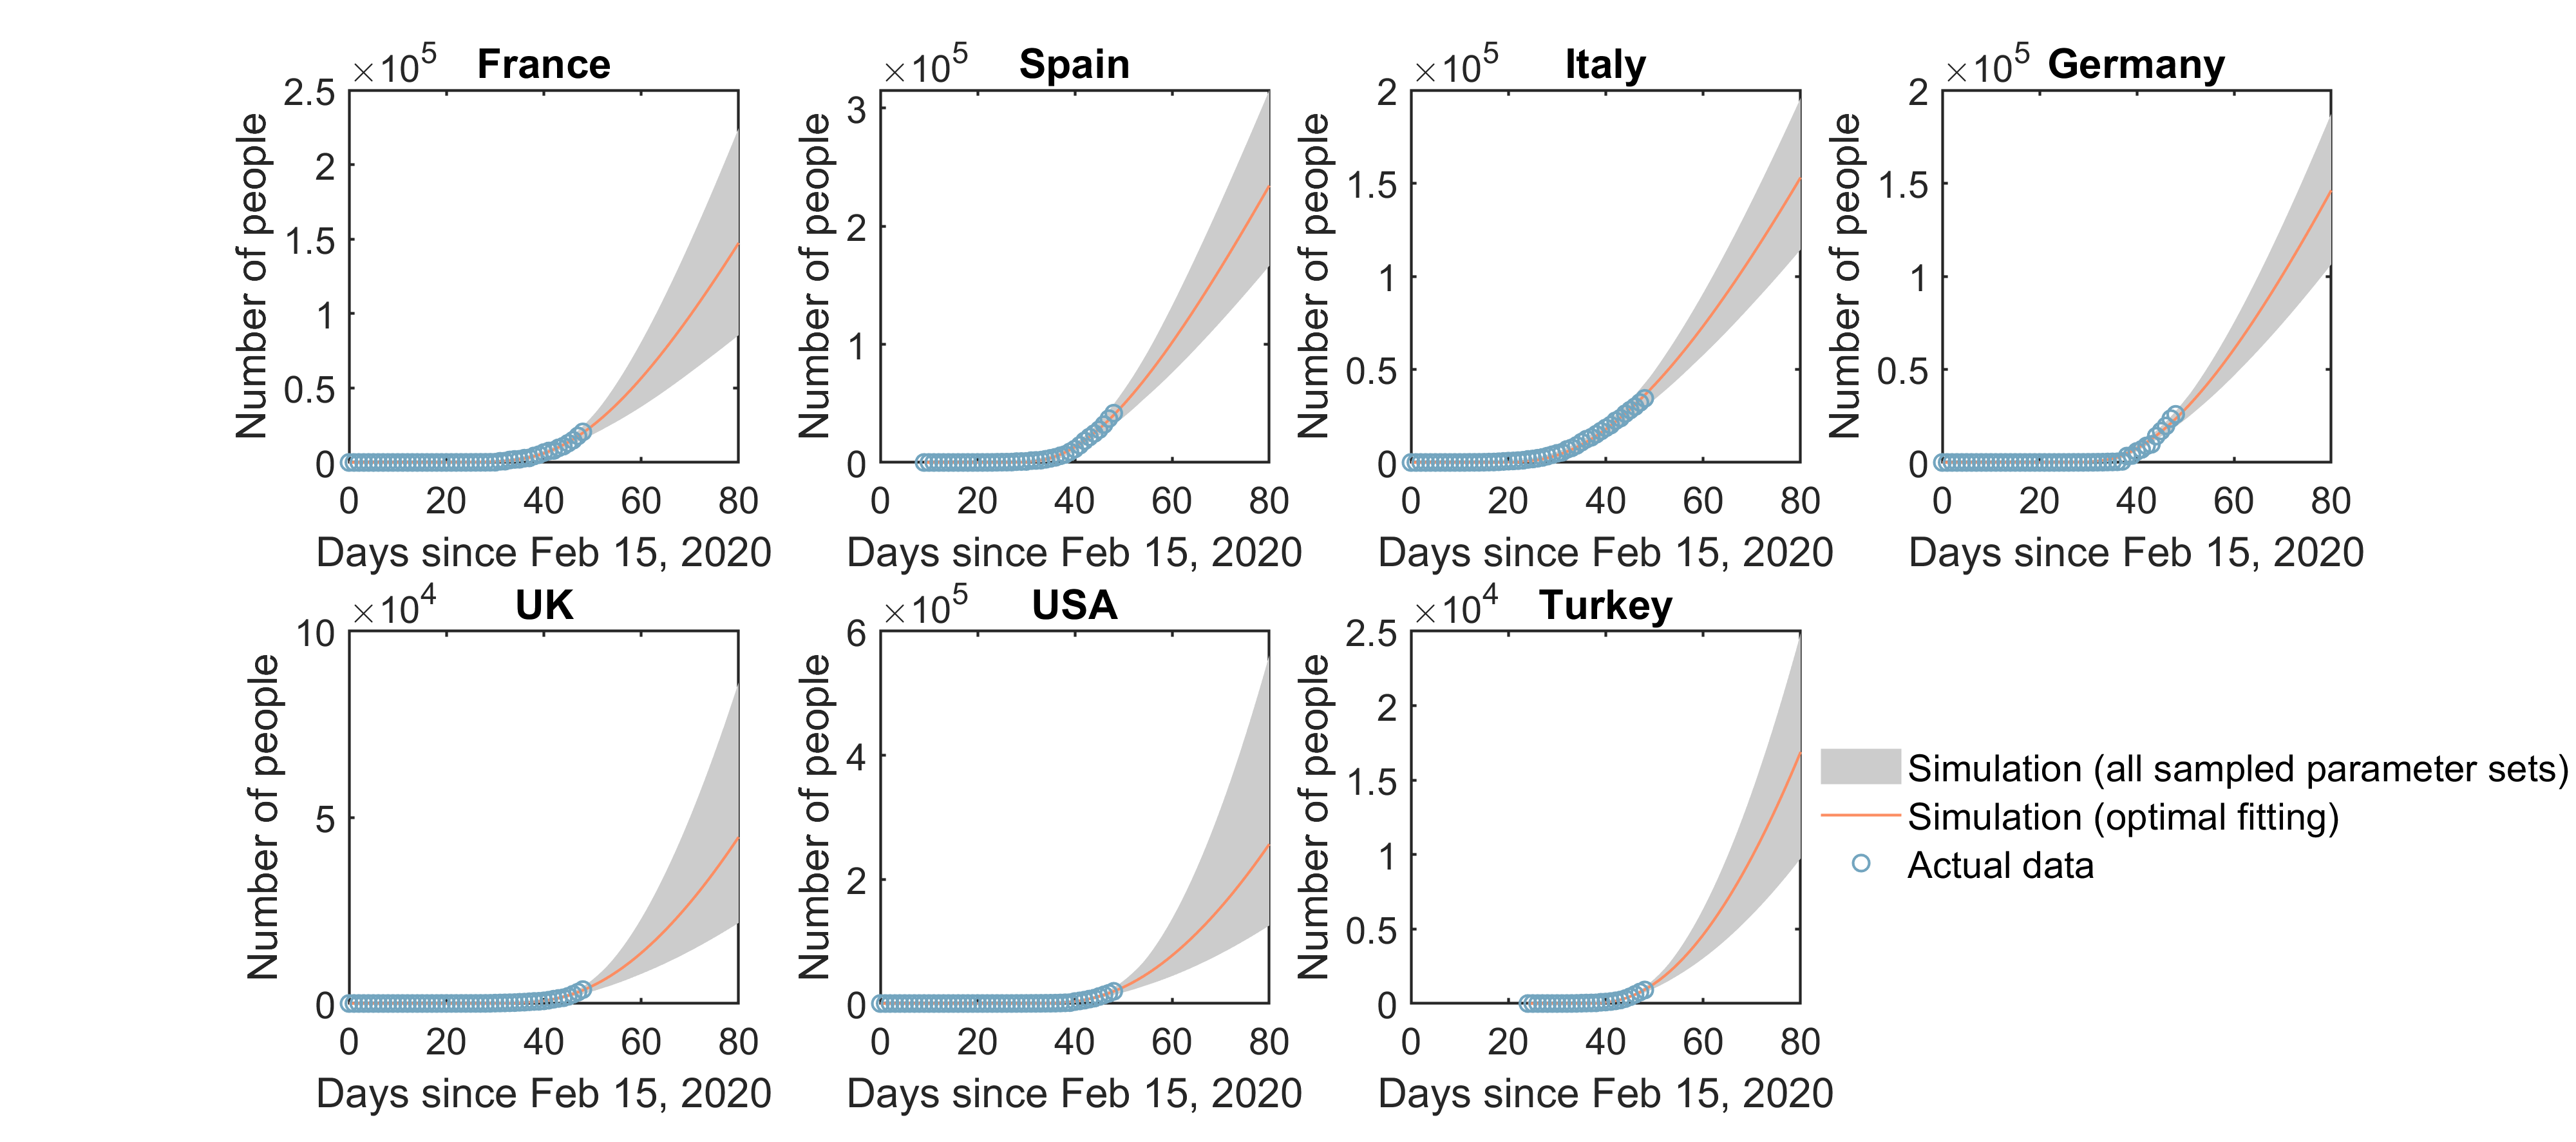
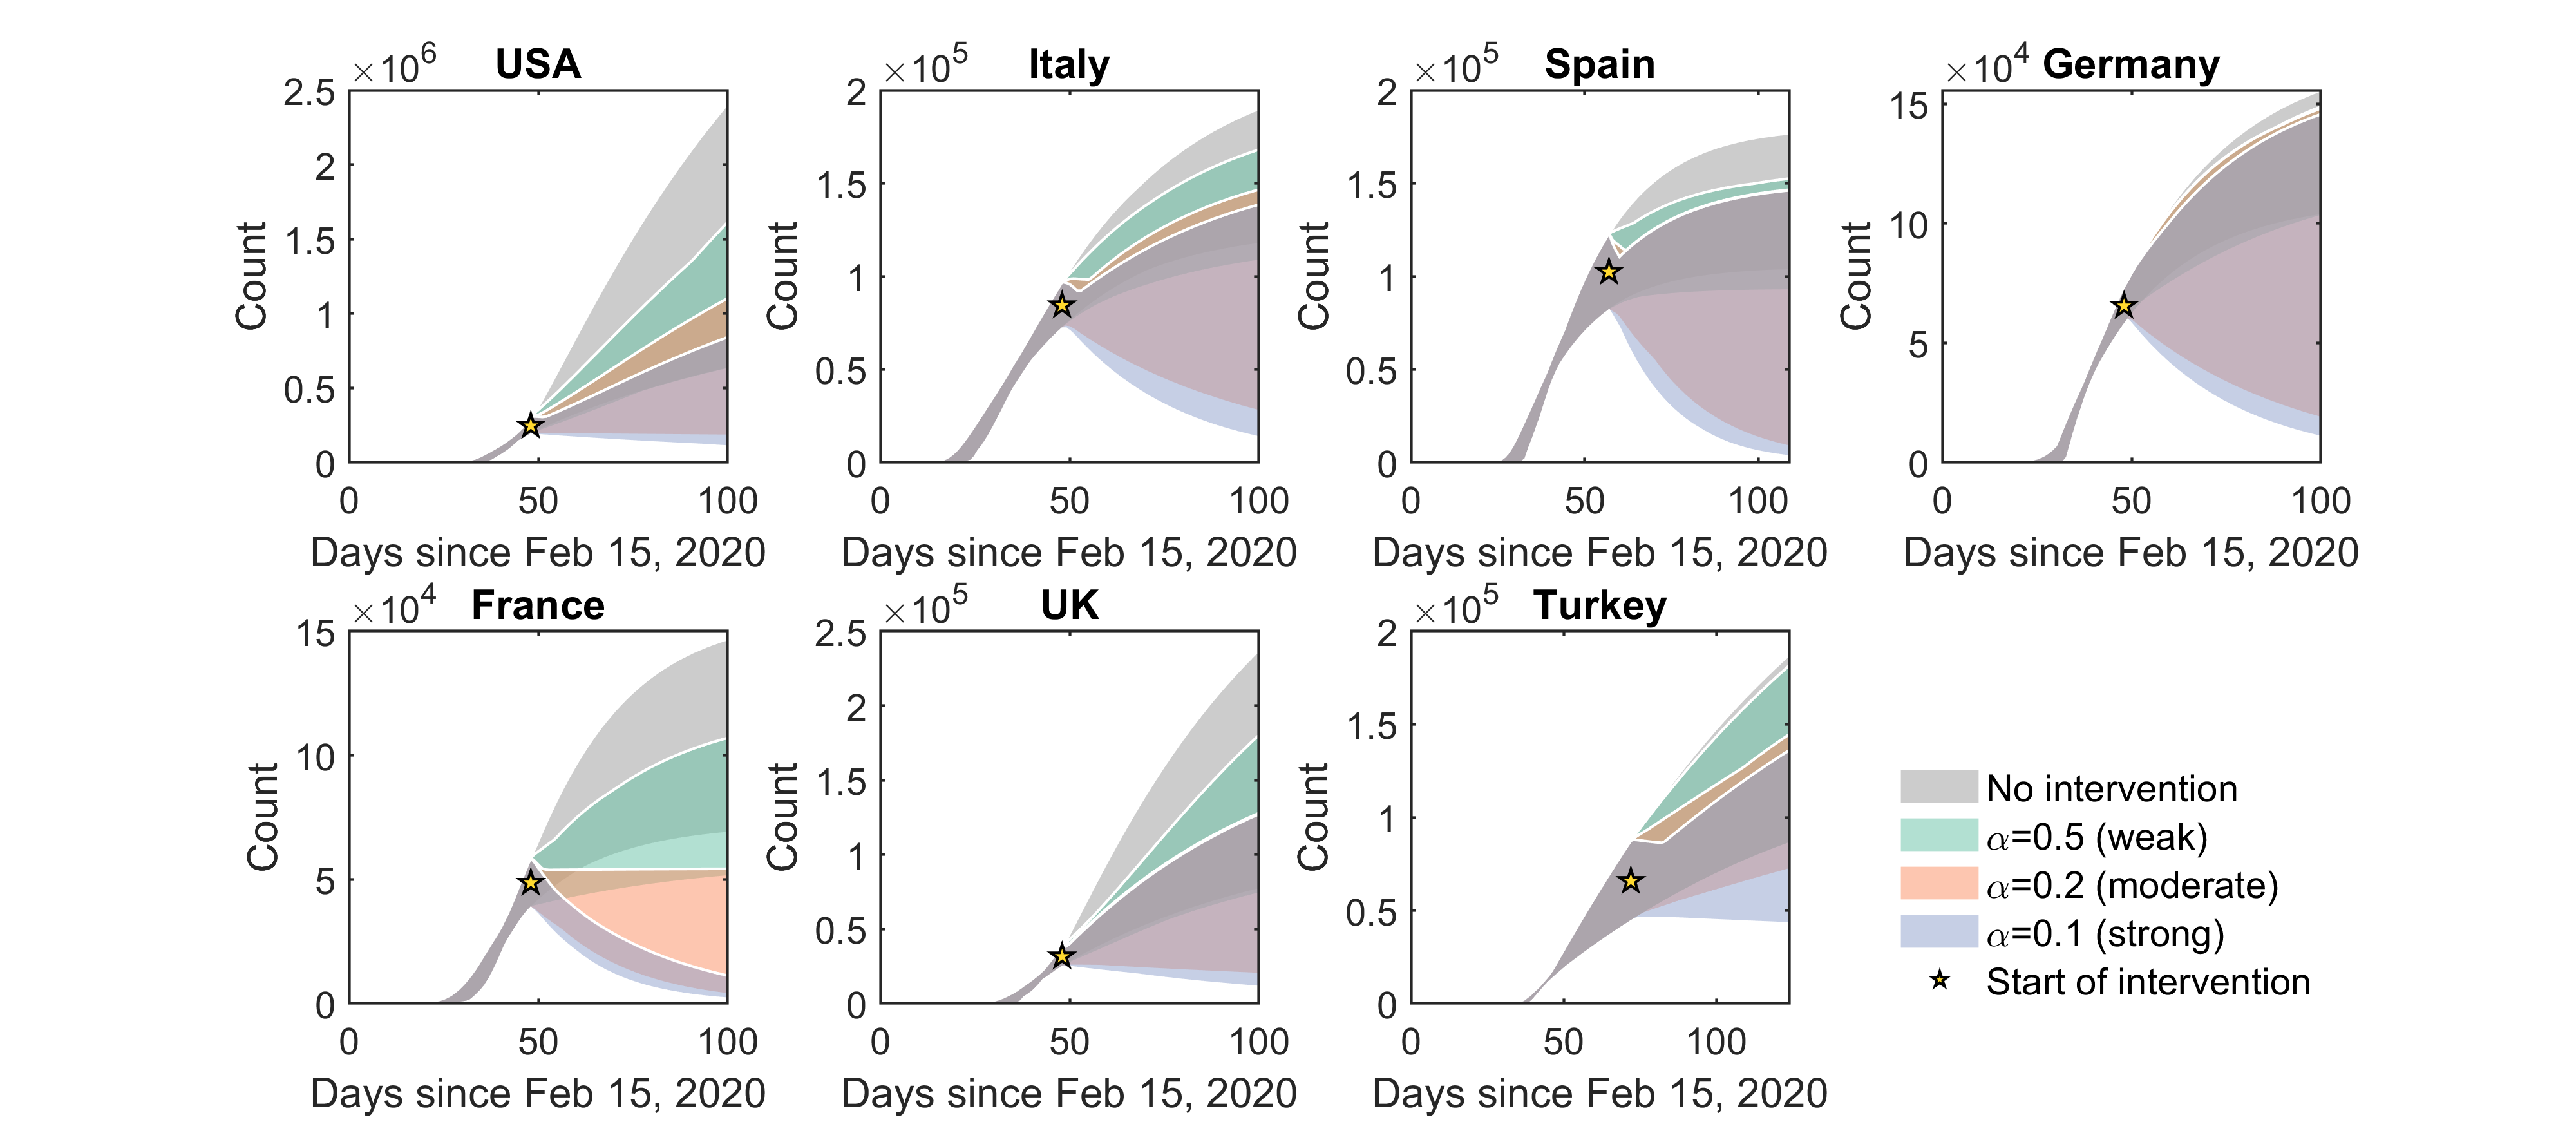
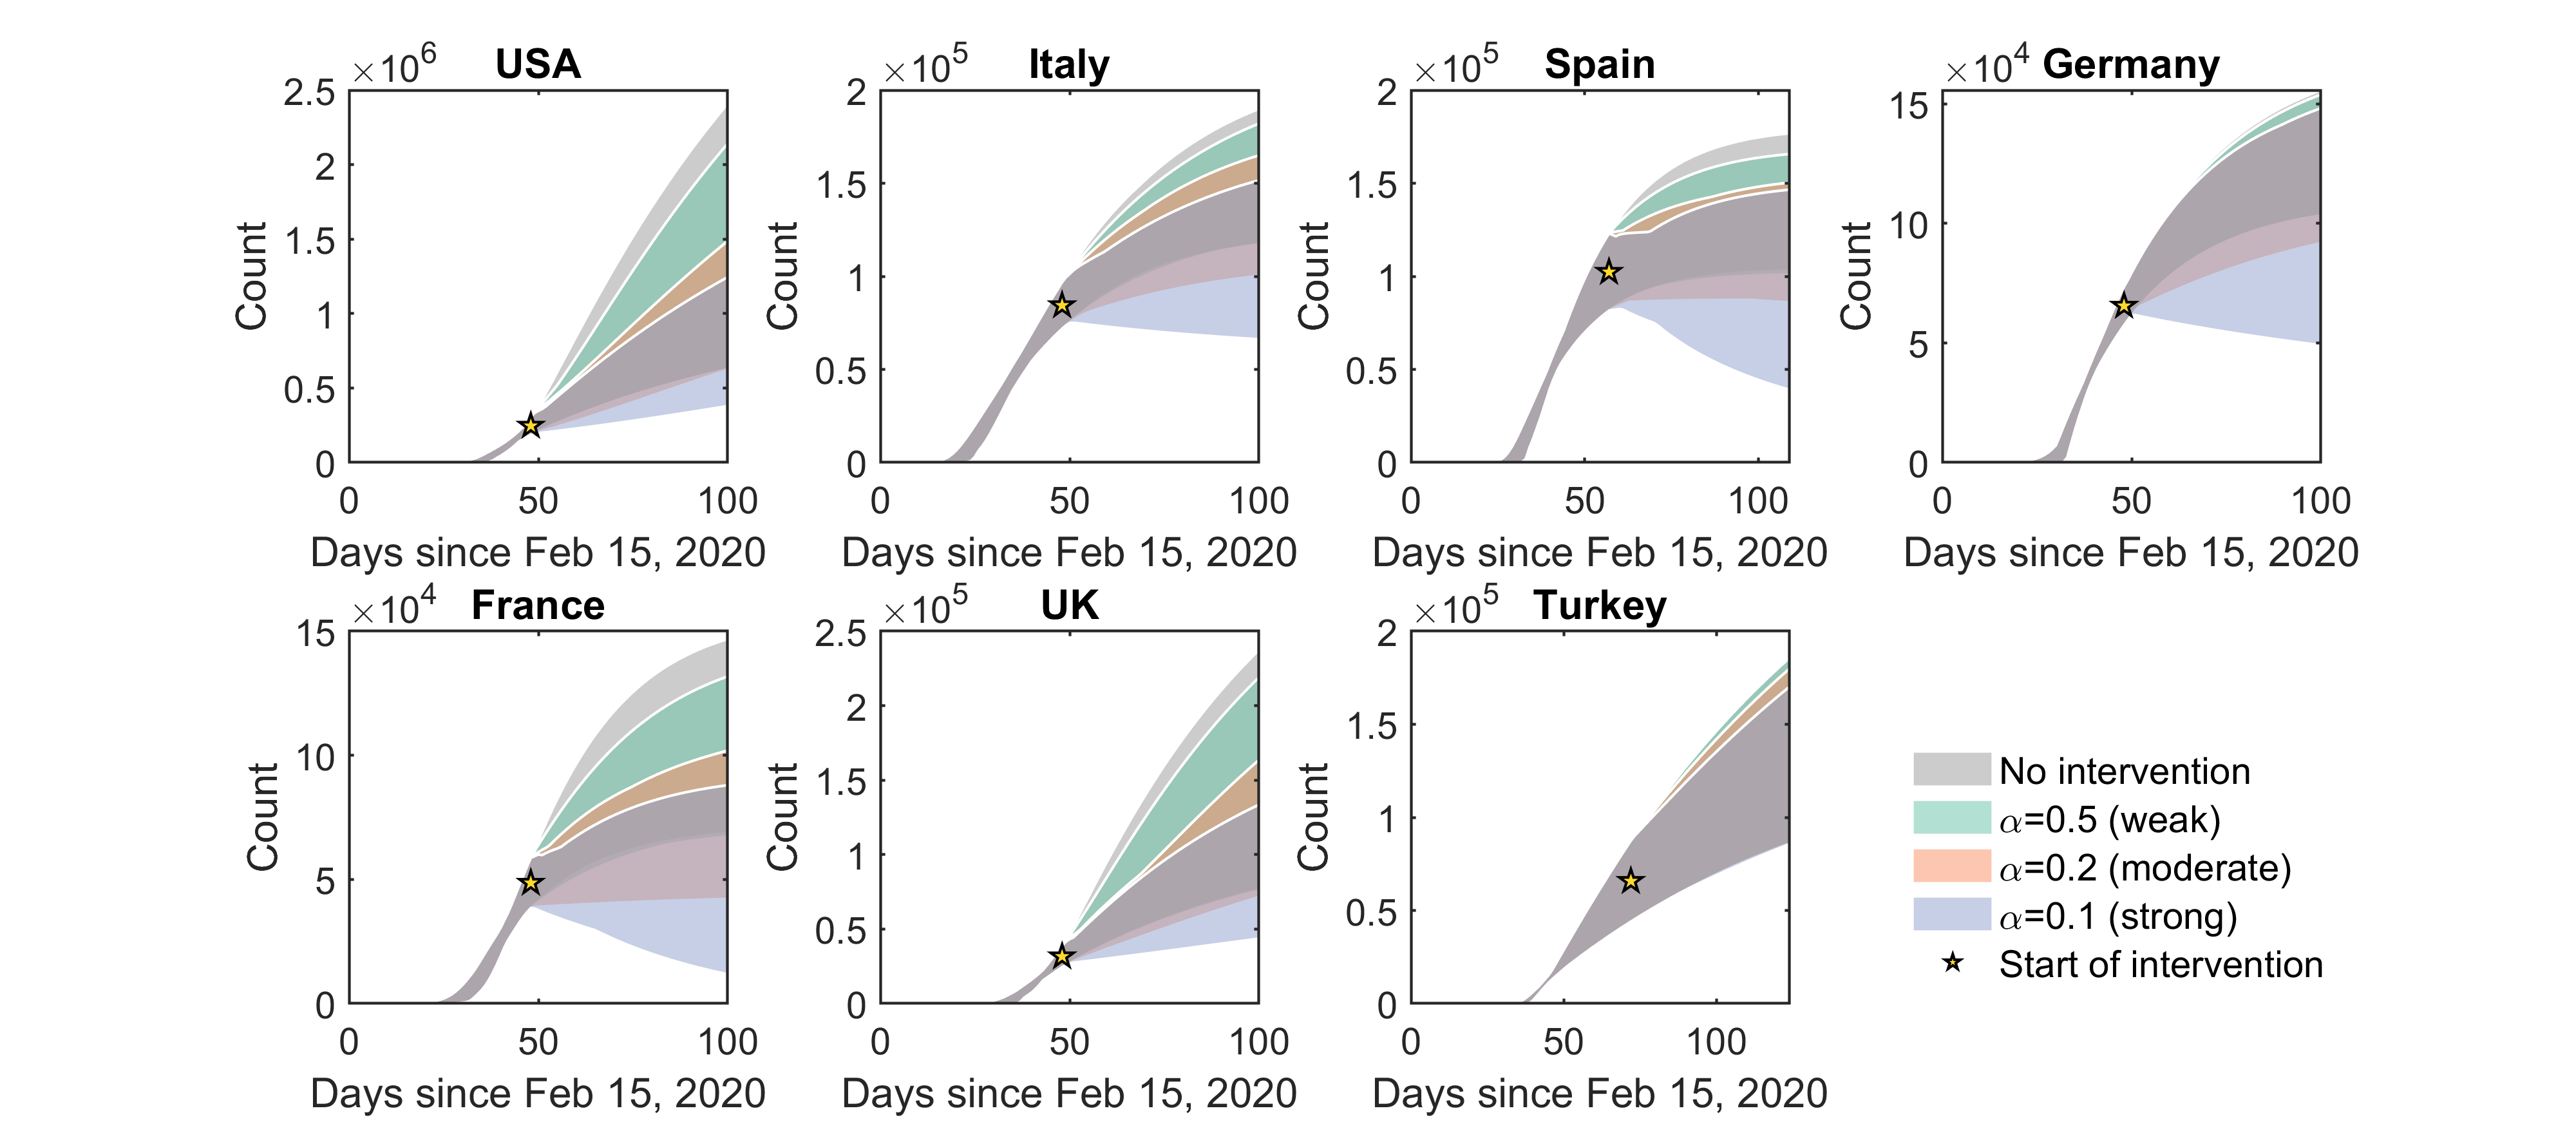
To validate the SINV model, it was first fitted to COVID-19 early transmission data in seven countries, including USA, UK, Turkey, France, Germany, Spain, and Italy. Early transmission dynamics of COVID-19 were accurately reproduced by the model in these countries, confirming that the model is able to capture the country-specific characteristics of COVID-19 spread.
Model fitting
Model-predicted and actual numbers of infected individuals
Model-predicted and actual total numbers of deaths and recoveries
Necessity of strong interventions
One essential function of mathematical models is to help us understand how we can effectively control processes in the nature, including spreading of infectious diseases such as COVID-19.
Using the mathematical model, we computed the daily numbers of infected individuals since the onset of COVID-19 pandemic in each country, assuming that interventions targeting either the entire population or only infected individuals with strength varying from weak, moderate to strong were launched on day 48 since the pandemic onset.
Infections under interventions targeting the entire population
Infections under interventions targeting infected individuals
State-by-state models for COVID-19 in the U.S.
We fit the mathematical model to COVID-19 transmission data in 51 U.S. states, and applied the fitted models to predict future COVID-19 transmission dynamics in these states. To evaluate efficiency of the non-pharmaceutical interventions in each state, we introduced to the model terms accounting for launching of interentions, such as stay-at-home orders, social-distancing, and releasing of these restrictions.
Model fitting
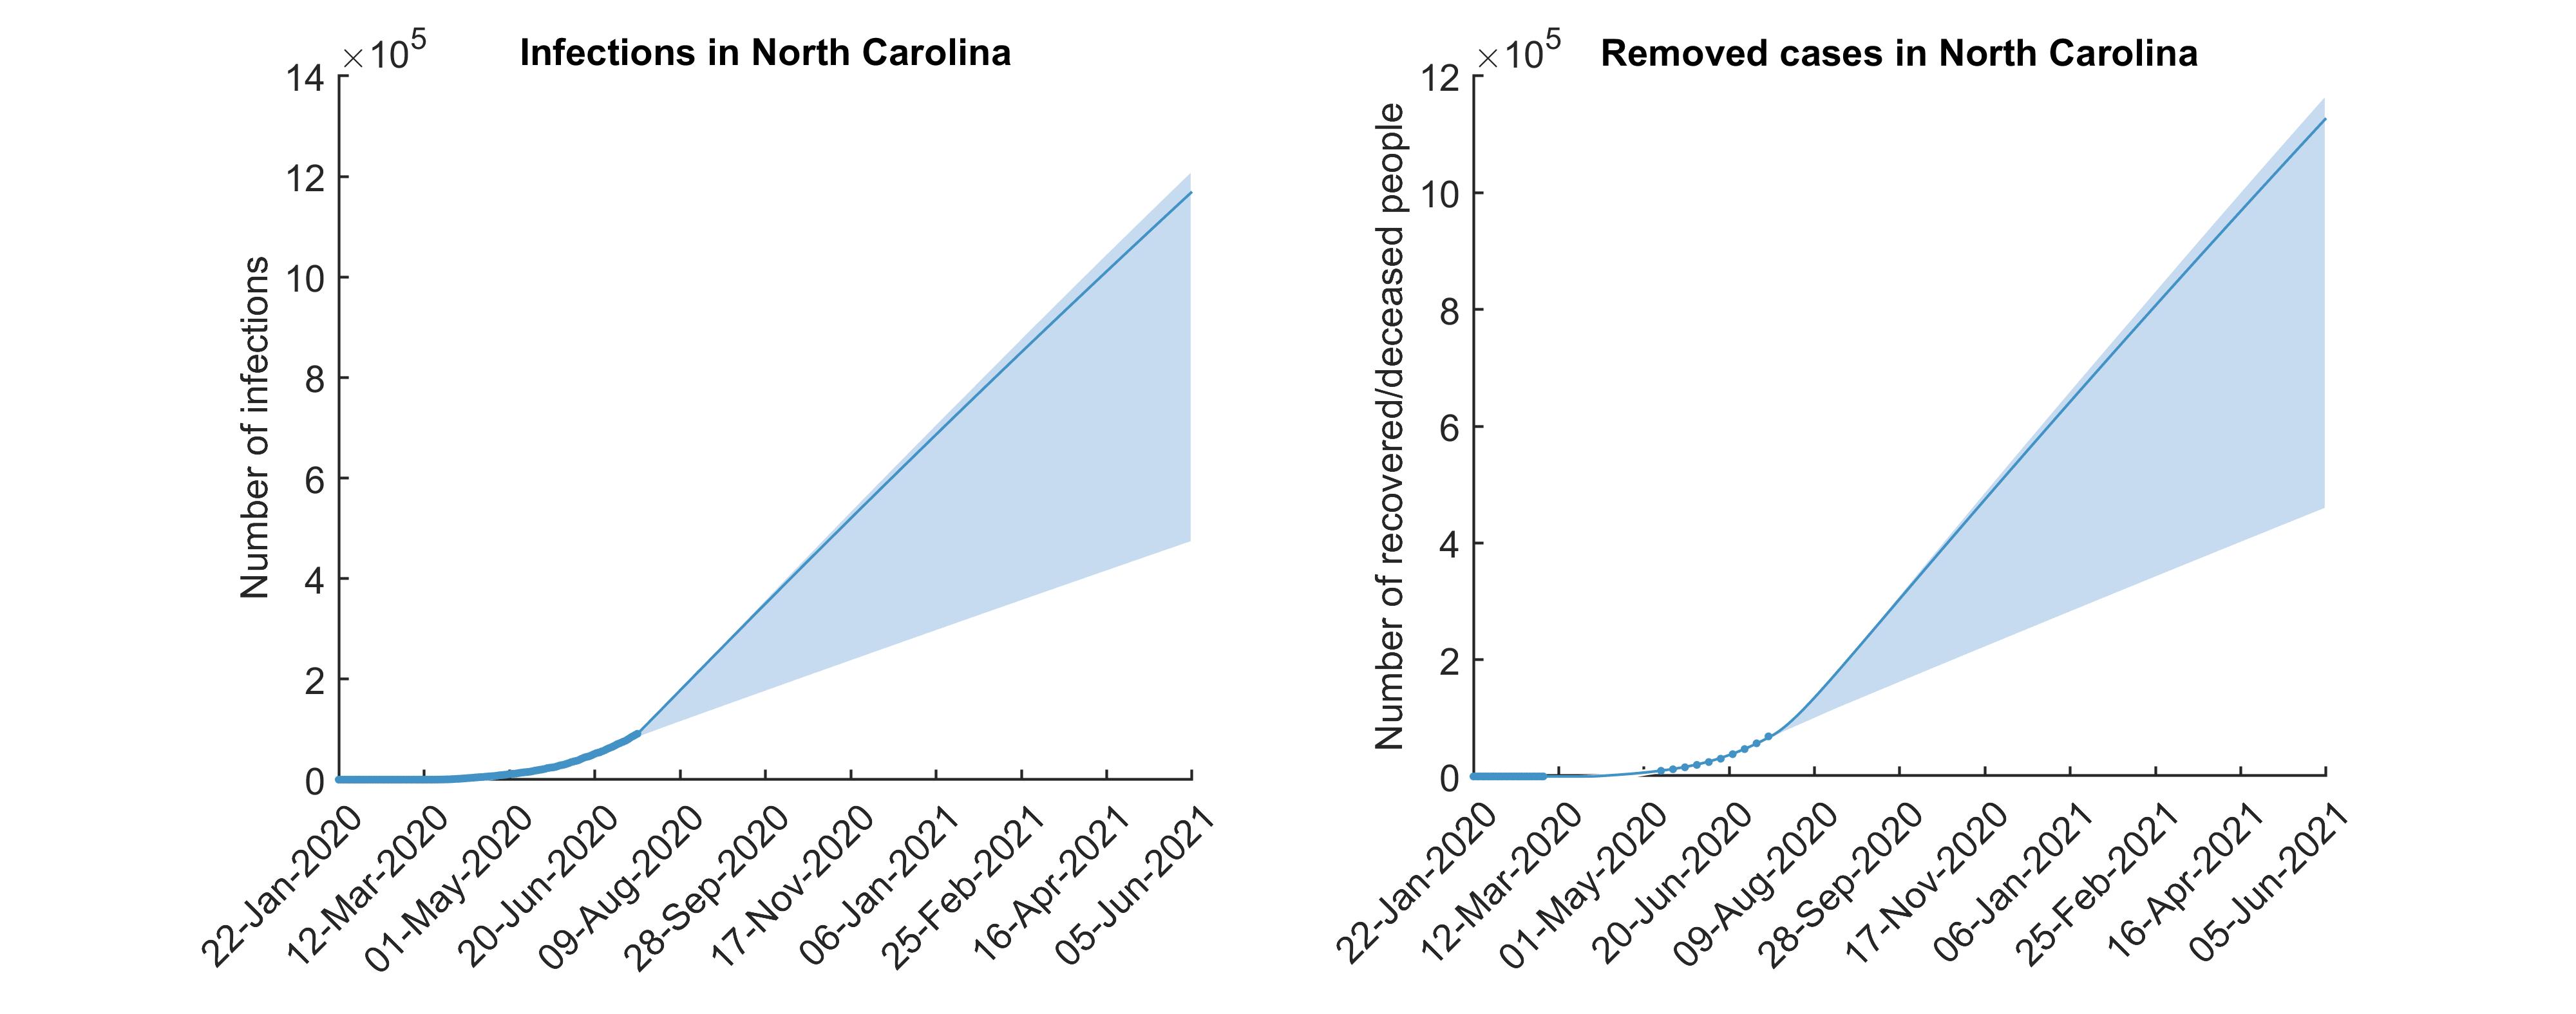
To see results for model fitting in a specific state, select a state from the dropdown menu below. Blue dots indicate actual data, blue solid lines are predictions made using the optimally fitting parameter sets, and blue shaded regions are predictions based on 500 random parameter sets.
Modeling fitting in North Carolina
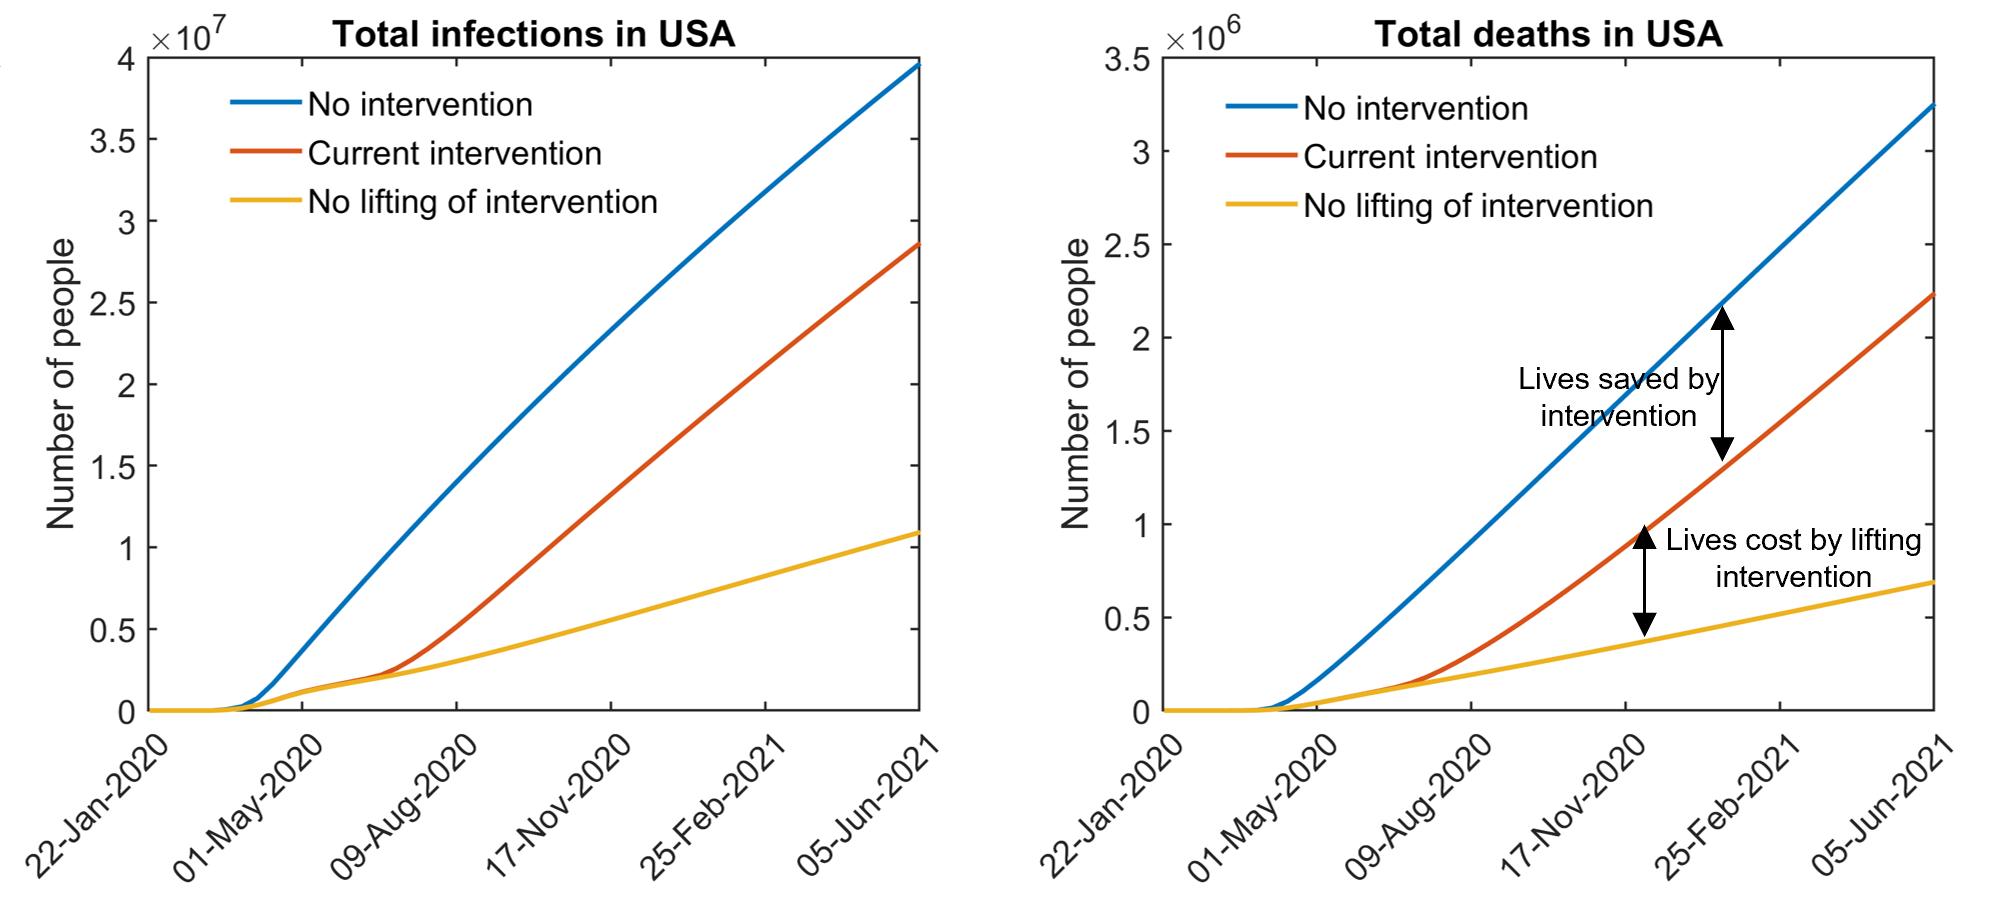
Total infections and deaths in the U.S.
Using the state-by-state models, we predicted the numbers of infections and deaths in USA, under three different assumptions:
- Current intervention: the current scenarios of intervention will be maintained in each state
- No intervention: no intervention was put in place in each state on any date
- No reopen: current interventions or restrictions were launched, but never lifted afterwards
According to the model predictions, the current interventions in USA states have prevented the spread of COVID-19 by some extent, but lifting of these interventions will also potentially result in substantial numbers of infections and deaths.
Model-predicted total infections and deaths under different intervention scenarios
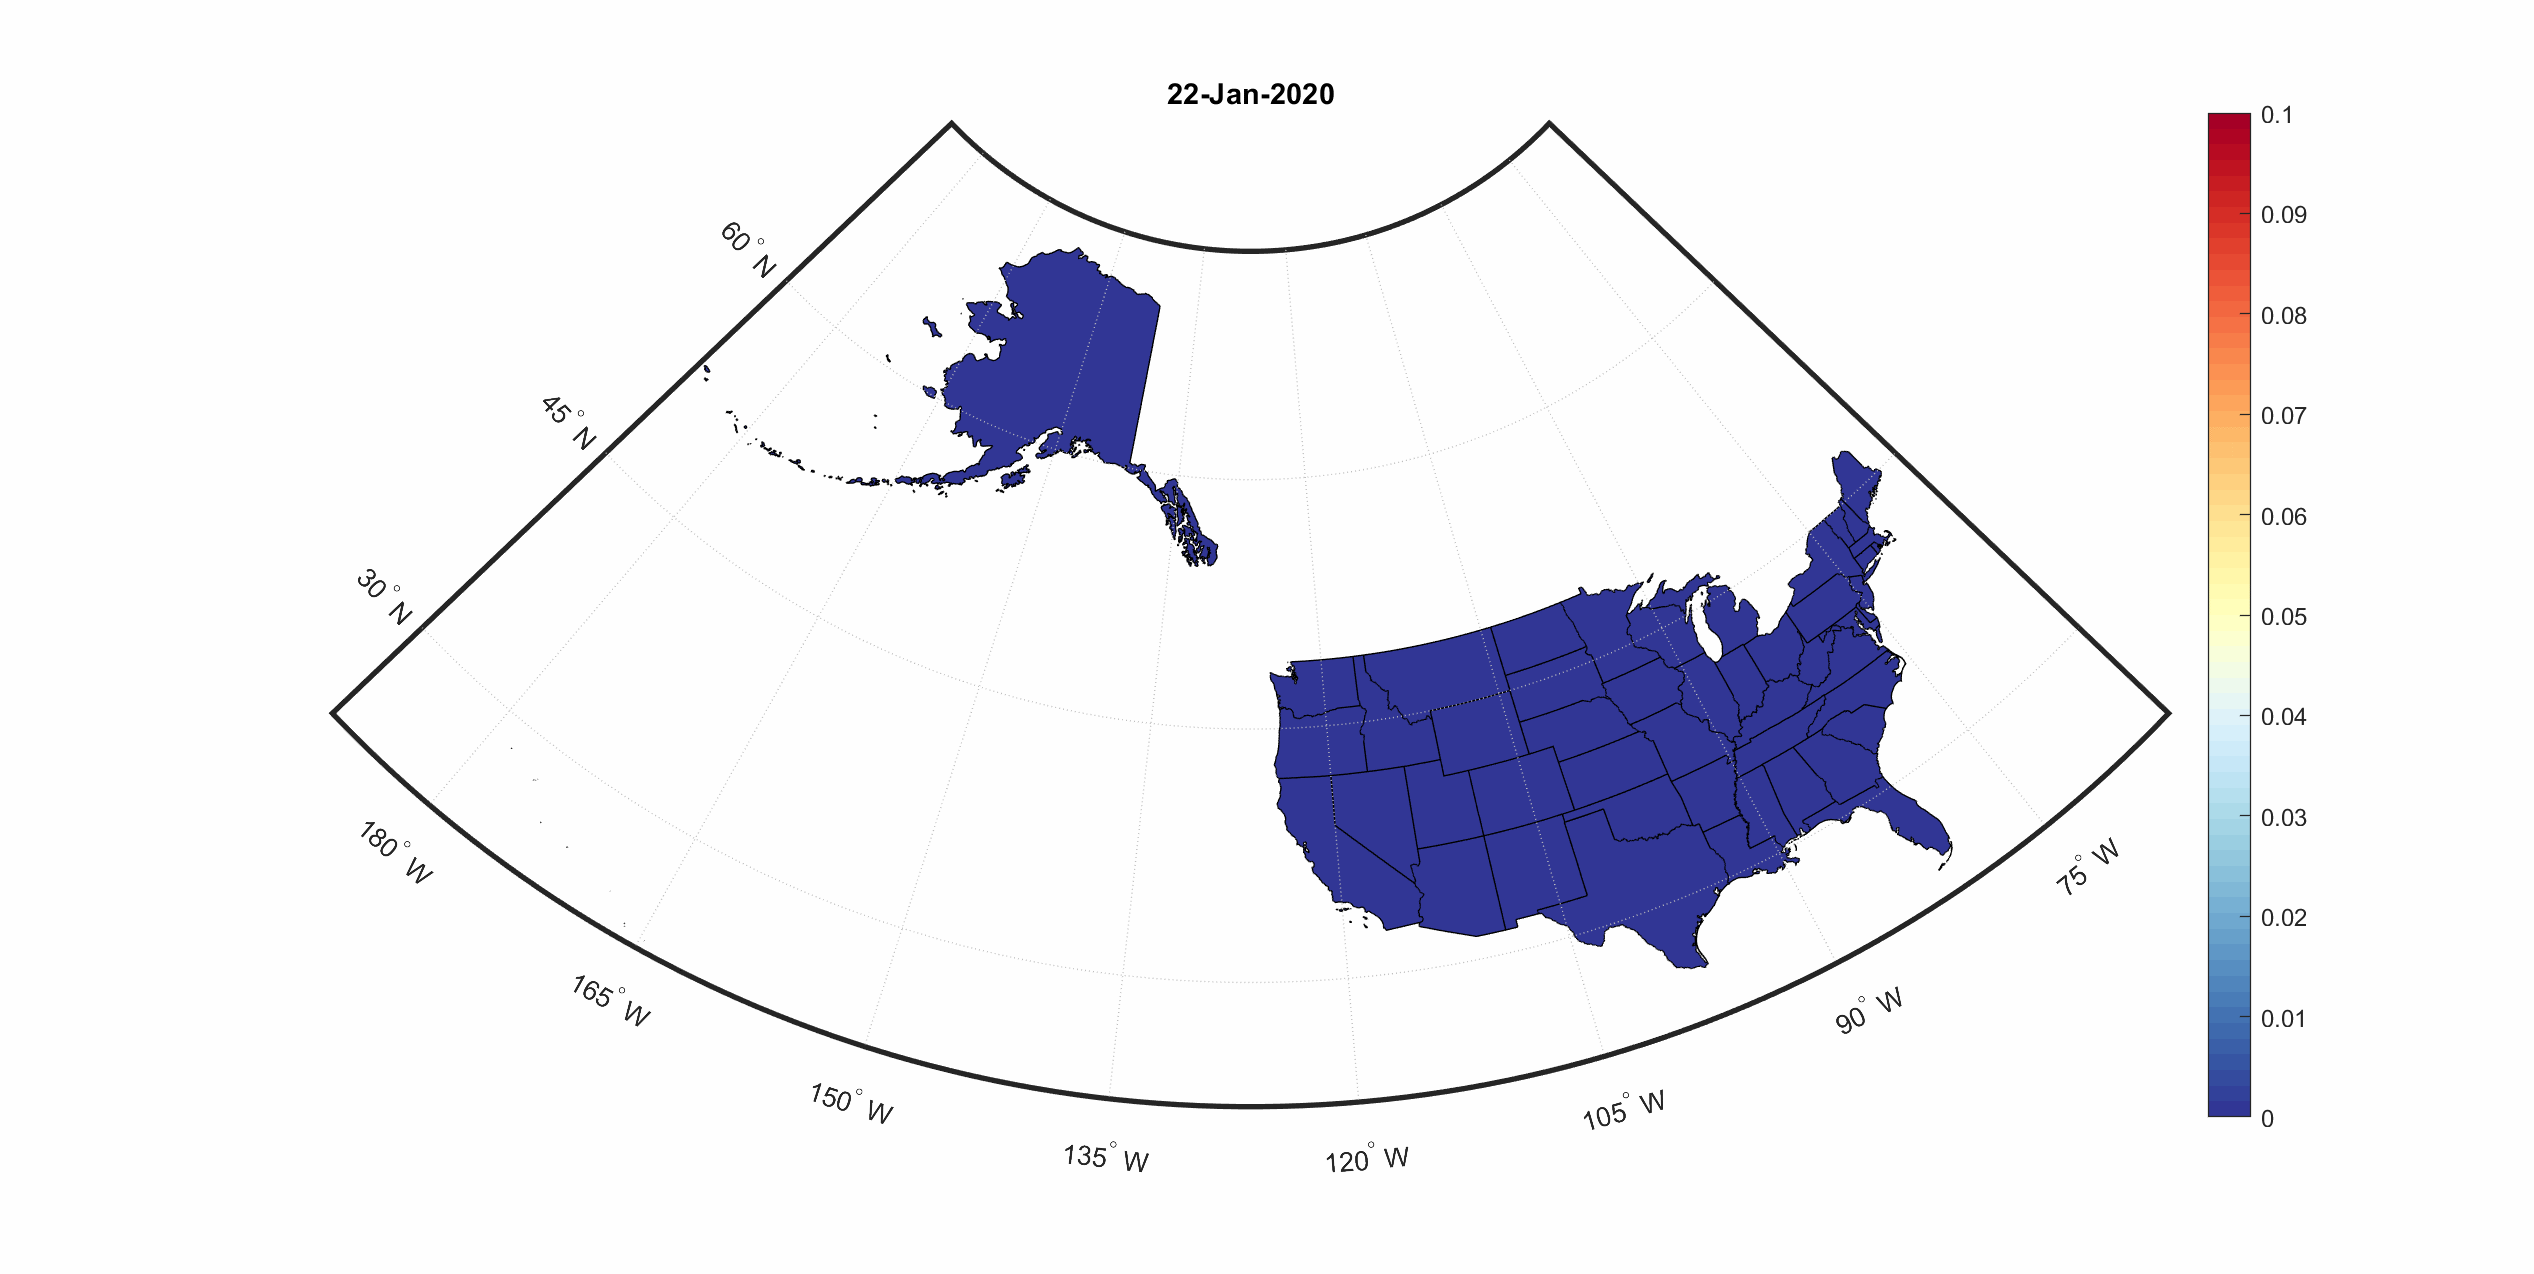
State-by-state infections and deaths in the U.S.
We also predicted future infections and deaths caused by COVID-19 in each U.S. state. For better visualization, numbers of infections and deaths were normalized to population in each state. To see the predictions, select an intervention scenario and a prediction from the dropdown menus below.
Model-predicted deaths under current intervention and reopen scenarios in U.S. states